Trade Journal
Your Dashboard is a full trade journal: every trade you log (or sync) feeds a calendar, a searchable trade log, and a stats engine built around one question - how disciplined is your trading?

The KPI bar
A compact strip above the tabs summarizes the selected range:
| KPI | What it means |
|---|---|
| Discipline | Your 0-100 Discipline Score as a ring, with tier label |
| Net P&L | Net realized profit and loss |
| Profit Factor | Gross profit ÷ gross loss - above 1.0 is profitable |
| Win Rate | Share of closed trades that won, with W/L counts |
| Total Trades | Closed trades in the range |
| Avg / Trade | Average realized P&L per closed trade |
Click More metrics to expand five secondary cards: Total Profit, Total Loss, Highest Profit, Greatest Loss, and % Profitable Days.
Discipline Score
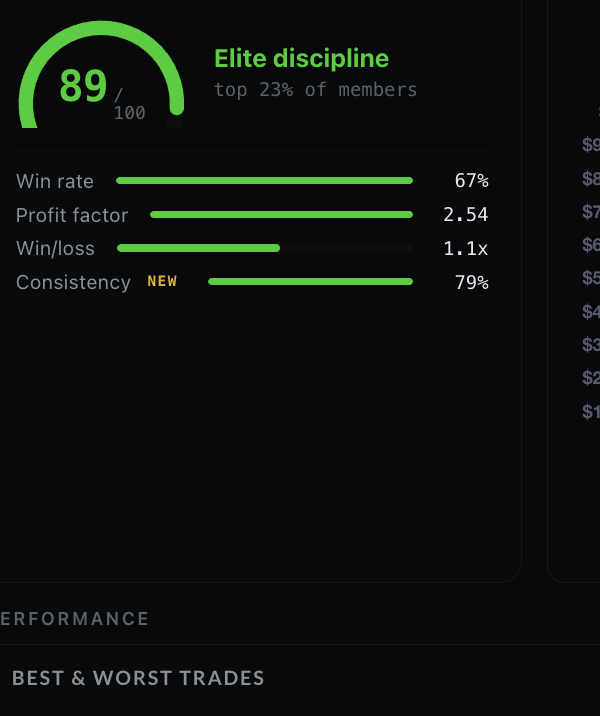
A 0-100 score that reframes "good trading" as discipline and consistency rather than raw P&L. It is computed from four weighted components:
| Component | Weight | Full credit at |
|---|---|---|
| Profit factor | 30% | 2.5x |
| Win rate | 25% | 60% |
| Win/loss ratio | 25% | 2.0x average win vs average loss |
| Consistency | 20% | 60% profitable days |
Tiers: Elite discipline (80+), Strong discipline (65+), Developing (45+), Needs work (below 45). The full score card - gauge, tier, and per-component bars - lives on the Stats tab; the KPI bar keeps a compact ring so header and Stats always agree.
Three tabs
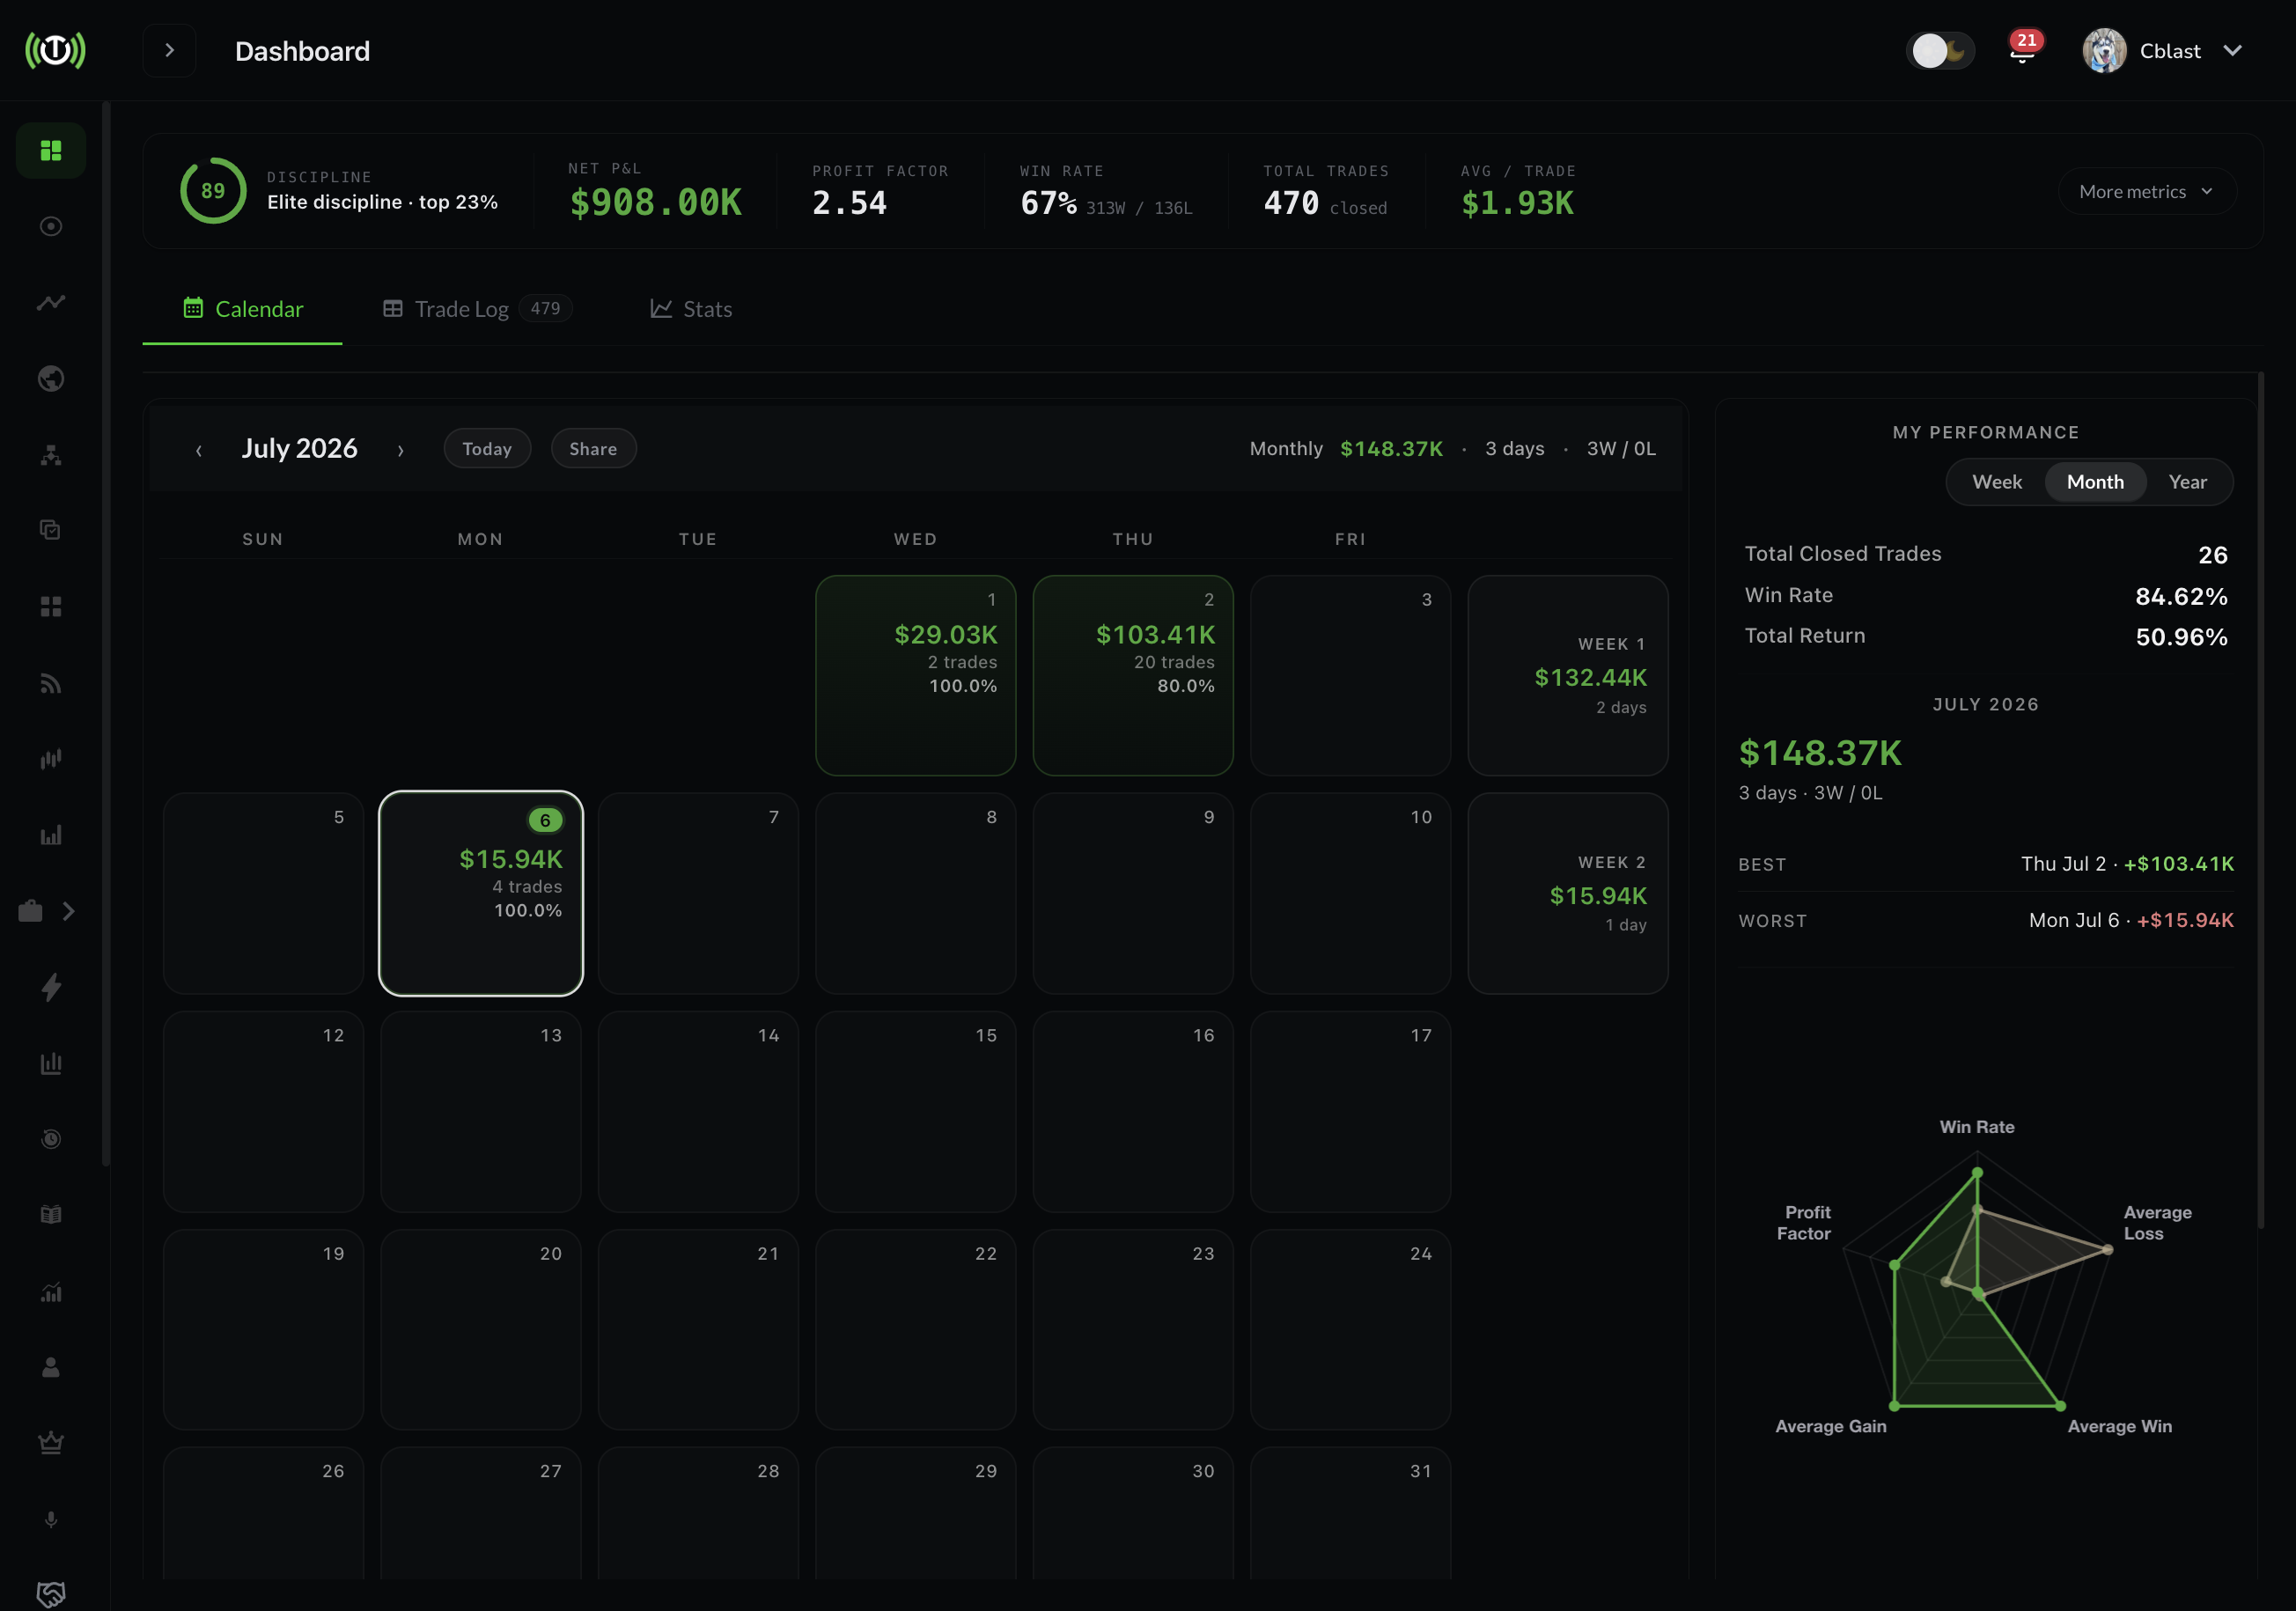
Calendar
Daily P&L on a month grid - spot your best and worst days, streaks, and weekly cycles at a glance. Click a day to see its trades.
Trade Log
A sortable, searchable table of every trade:
- Search by ticker; filter by date range, P/L, or trade type
- Edit or delete manual trades; batch-select multiple rows
- Rows synced from copy trading are read-only in the journal (they came from a pilot you copy) - you can still journal notes and ratings on them
- Export what you see
Stats
The deep-dive: Discipline Score card, headline metrics, and the Consistency panel - profitable-day summary, max win / loss streaks, and day-of-week and time-of-day P&L bars so you can see when your edge shows up (and when it doesn't).
Reviewing a trade
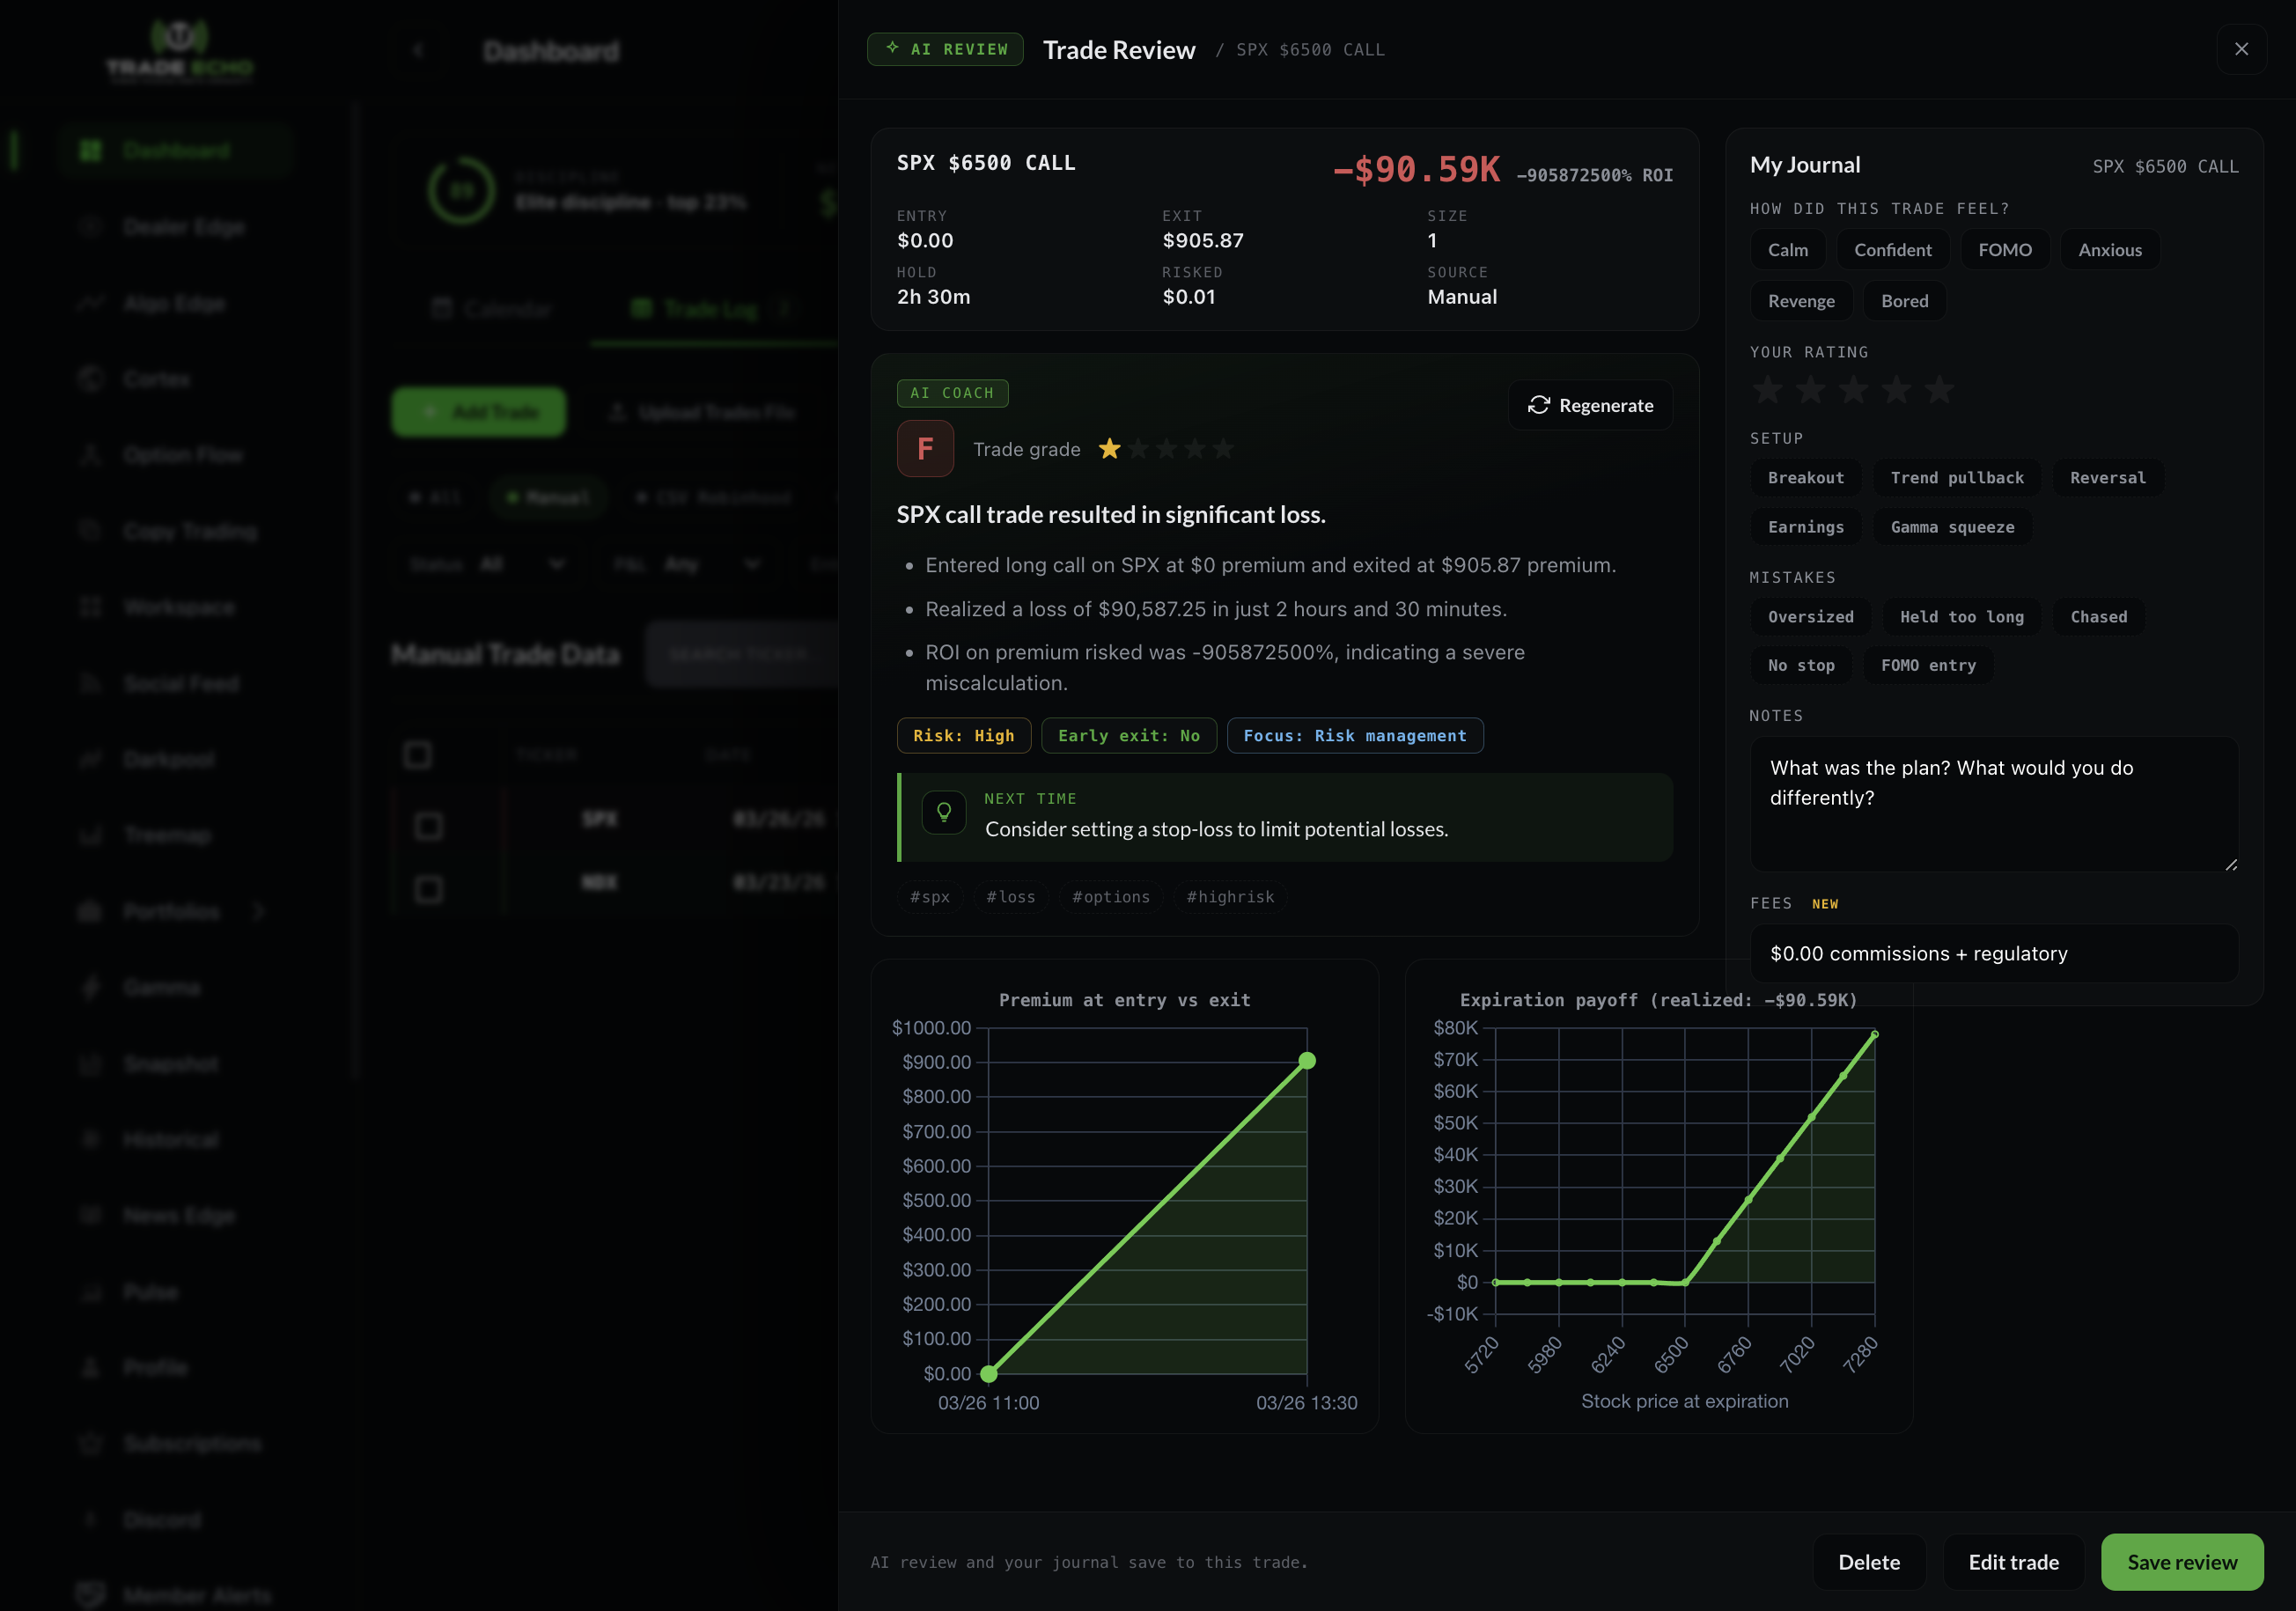
Open any trade to slide out the review drawer (right side, no popup):
- Notes - your thesis, what worked, what didn't
- Fees - log commissions and fees per trade
- Ratings - grade your execution
- AI Review - ask for an AI read on the trade
Getting trades in
- Manual entry - Add Trade, fill in ticker, prices, dates, quantity, and notes.
- Bulk upload - the Upload Trades page accepts
.xlsx,.xls, or.csvfiles. - Broker sync - connect your broker once and fills import automatically. See Broker Sync.
Copy trading fills also appear automatically if you use Copy Trading.
Web and mobile
The journal works on web and mobile - log, review, and track from either. The redesigned KPI bar, Discipline Score card, and Consistency panel described above are the web dashboard experience; mobile keeps the core journal, calendar, and stats.
Next Steps
- Broker Sync FAQ - connect your broker for automatic imports
- Risk Management Overview - turn journal insights into rules
- Daily Trading System - the evening review habit