Futures Quick Start
Get reading in 5 minutes. This guide is for members opening the Futures tab for the first time.
Open the app at app.tradeecho.com - Futures in the sidebar (route /futures).
Futures data requires a one-time free CME data attestation in the app before live data appears - futures are included in every membership.
What You're Looking At
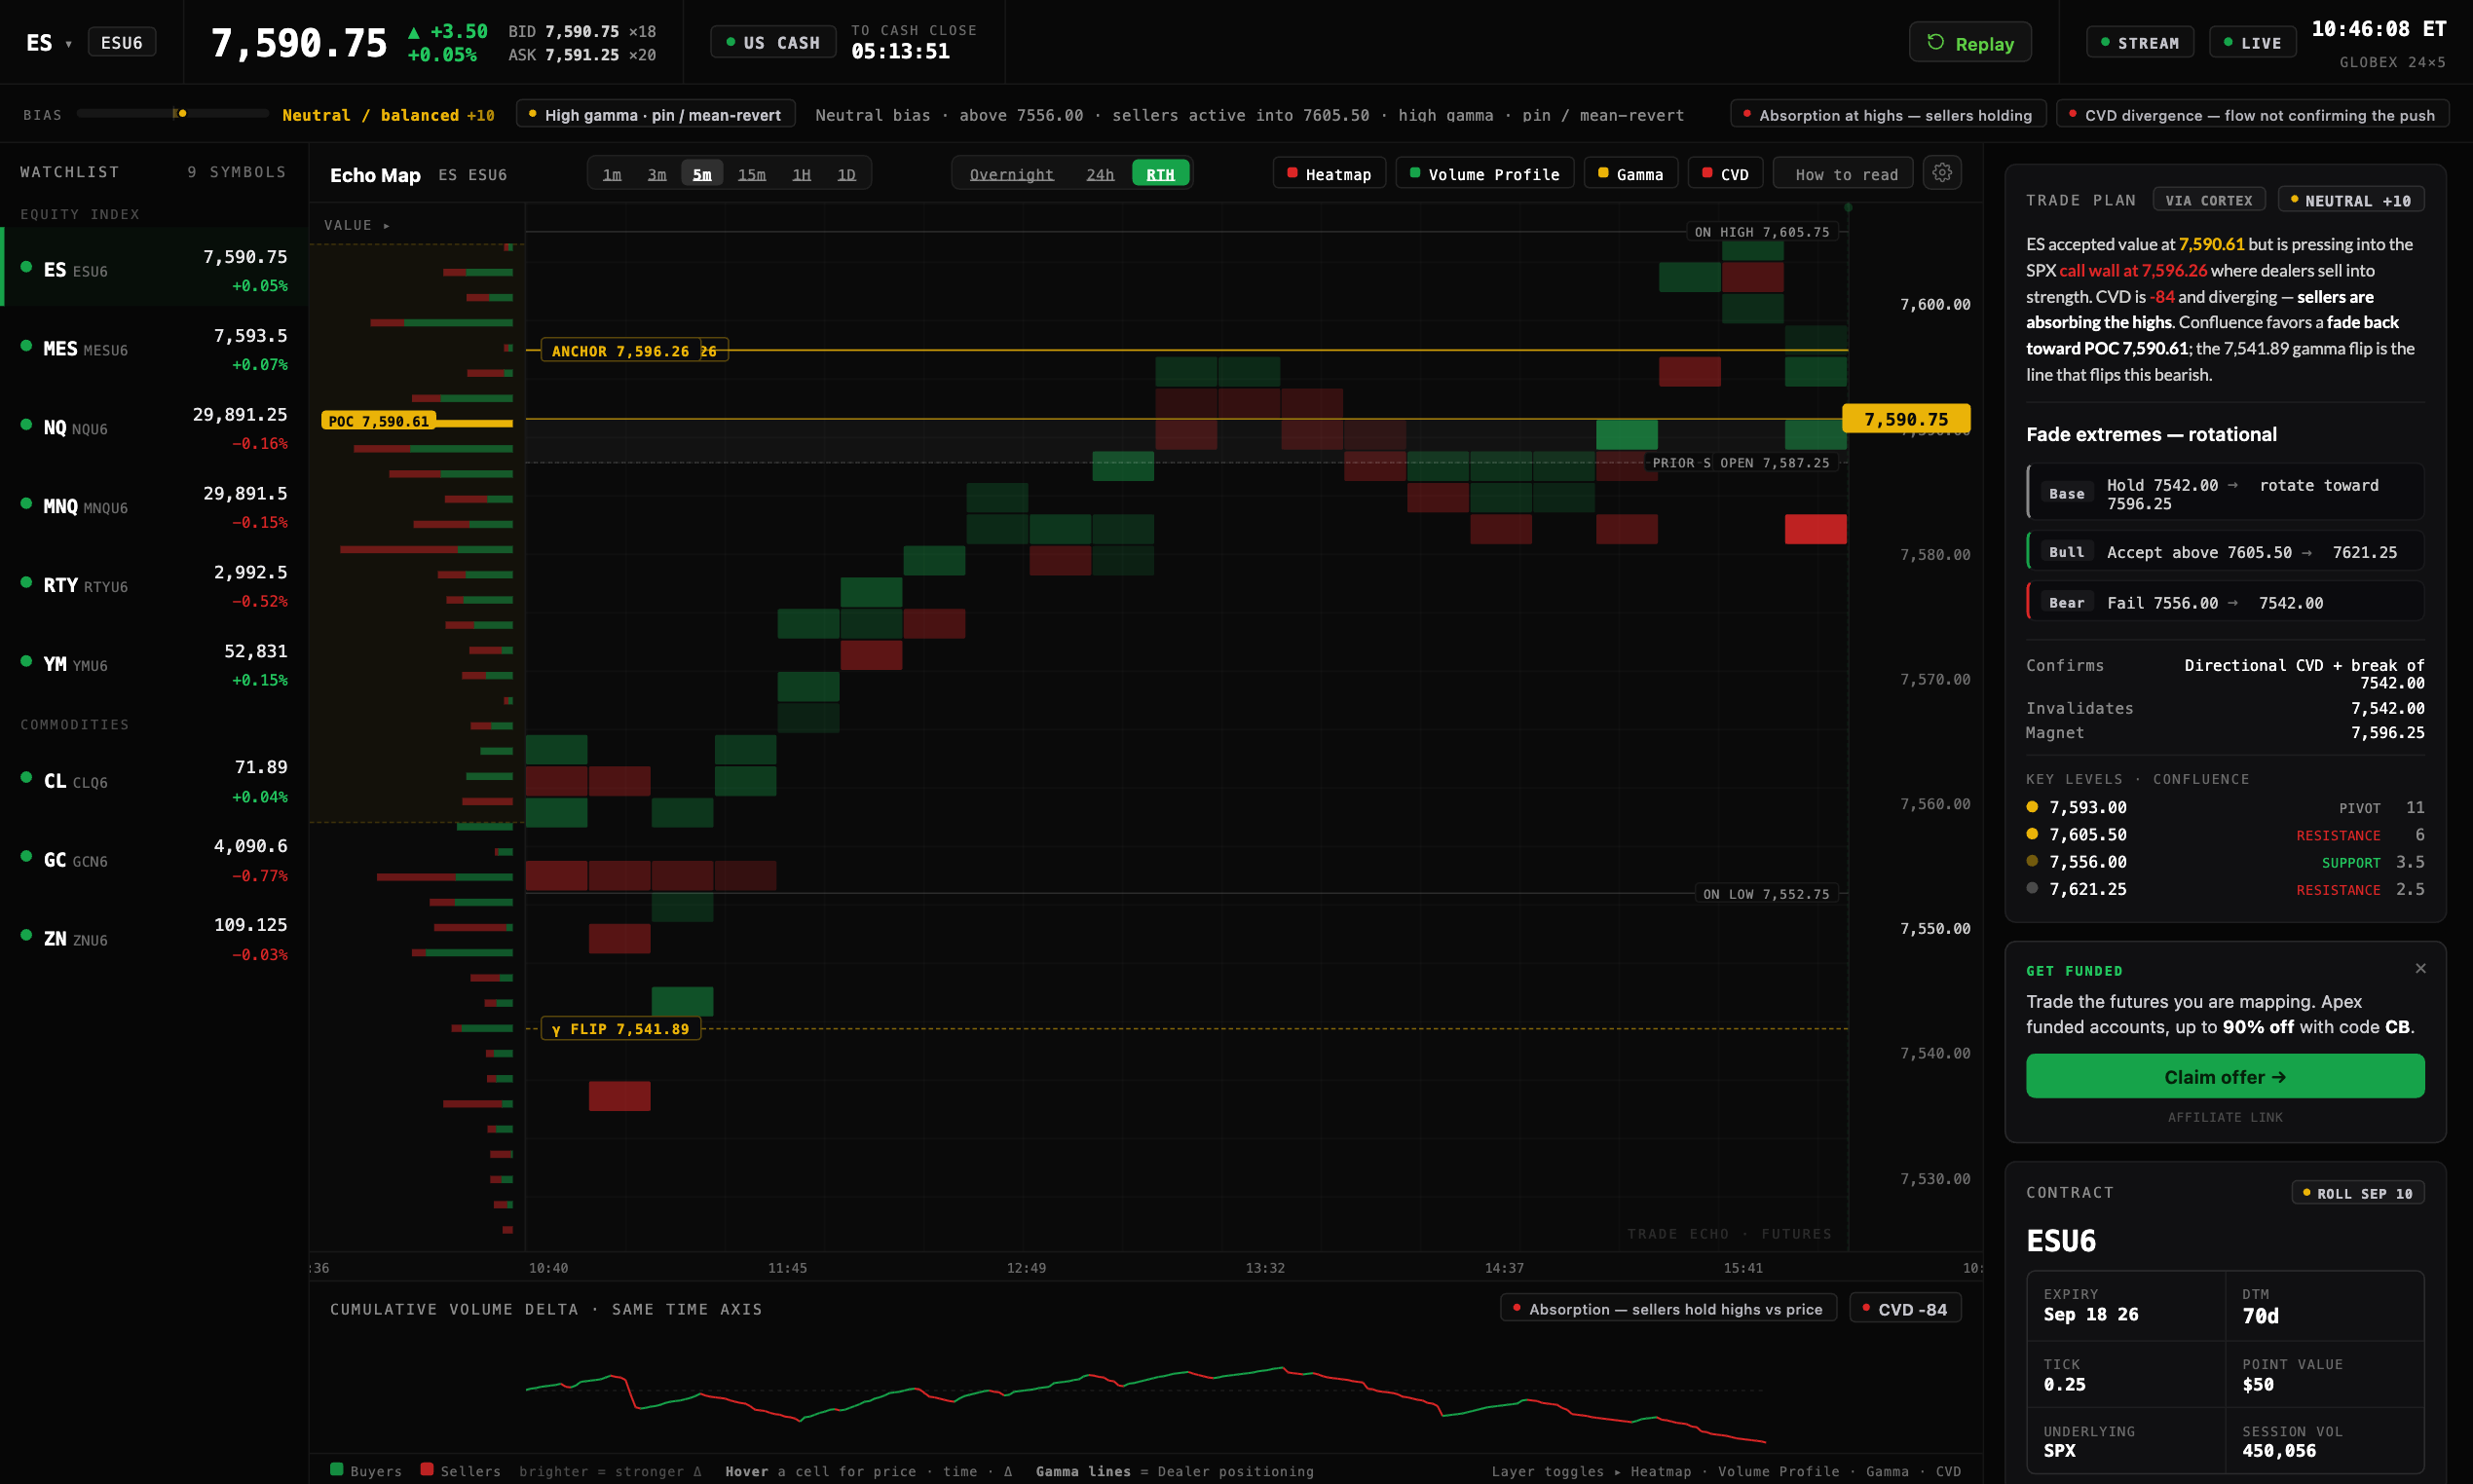
The Echo Map is a price-by-time heatmap of a futures contract, running on officially licensed CME Group real-time data, 24x5. Price runs up the side, session time runs across the bottom, and four layers stack on one axis:
- Pressure heatmap (center) - green and red cells showing where buyers or sellers committed volume. Brighter = stronger delta.
- Volume profile (left gutter) - how much volume traded at each price, with the POC (point of control, the amber bar) and the dashed value area.
- Gamma force lines (right rail, amber) - SPX/NDX dealer positioning projected onto the futures price axis. Call Wall, Put Wall, Anchor, Flip, Prior, and overnight high/low are your magnet ladder.
- CVD (bottom strip) - cumulative buy vs sell aggression on the same time axis as the map. Flow confirms or kills what the heatmap shows.
The bias ribbon above the map summarizes the default regime. When it disagrees with CVD, trust flow.
The amber tag on the right edge is the live price, streaming in real time.
The 60-Second Version
Step 1: Find the amber lines
Call Wall above price is where dealers sell into strength. Put Wall below is where they buy weakness. Anchor is the strongest magnet on the map. Gamma Flip (dashed) is where the market changes character.
Step 2: Where is price vs the value area?
If price is inside the value area (dashed band by the volume profile), expect rotation. If it is above the value area and holding, buyers accepted higher prices - that is a trend day signal. Rejected back inside? Fade it.
Step 3: Check CVD agreement
The Cumulative Volume Delta strip below the map shares the same time axis. Price making highs while CVD makes lower highs = absorption - sellers are meeting the push. Price up with CVD up = real buying.
Step 4: Read the Trade Plan
The right rail's Trade Plan (written by Cortex from the live map) gives you the bias, the base/bull/bear scenarios with exact levels, and the confluence-scored key levels. It updates as the session develops.
Your Toolbar
- Bar interval: 1m / 3m / 5m / 15m / 1H / 1D - resolution of the heatmap and price data
- Session lens: 24h / RTH - filter the map to the session window you trade
- Auto Live: stream live ticks into the forming column, or freeze the map to study a moment
- Layer toggles: Heatmap, Volume Profile, Gamma, CVD - isolate one layer at a time while you learn
- Map controls: fit/reset the Y axis, plus a right-click menu with Reset chart view and Copy price
- Replay: scrub back through any session and watch how the map developed, bar by bar
- Share / copy image: export the current map from the toolbar
- Gear menu: hide the watchlist or trade-plan rails, add a price line or candles overlay
The Watchlist
Nine contracts, all live: ES, NQ, RTY, YM plus micros (MES, MNQ), and CL, GC, ZN. The active symbol's price ticks in real time; the rest refresh continuously. Note: gamma force lines appear only on equity-index contracts (ES/NQ/MES/MNQ/RTY/YM) - crude, gold, and notes have no equity options chain to project from, so those maps show value terrain and pressure only.
Honest Mechanics
- Prices, tape, and CVD stream in real time over a live connection; the structural layers (heatmap, volume profile, gamma) refresh continuously on a short cycle.
- Trade classification uses the tick rule (uptick = buyer-initiated, downtick = seller-initiated) applied to every individual CME trade - real prints, standard aggressor inference.
- The gamma layer is SPX/NDX dealer positioning from Dealer Edge projected onto the futures price via the index basis. It is the same math you already use on the GEX heatmap, drawn where futures traders can act on it.
Where to Go Next
- Reading the Echo Map - four layers, read order, and the IF / THEN cheat sheet
- Gamma on Futures - Call Wall, Put Wall, Anchor, and Flip on ES
- Trade Plan & Session Replay - the decision panel and the rewind button
- Pulse Quick Start - simpler candle chart with overlays when you do not need the full map