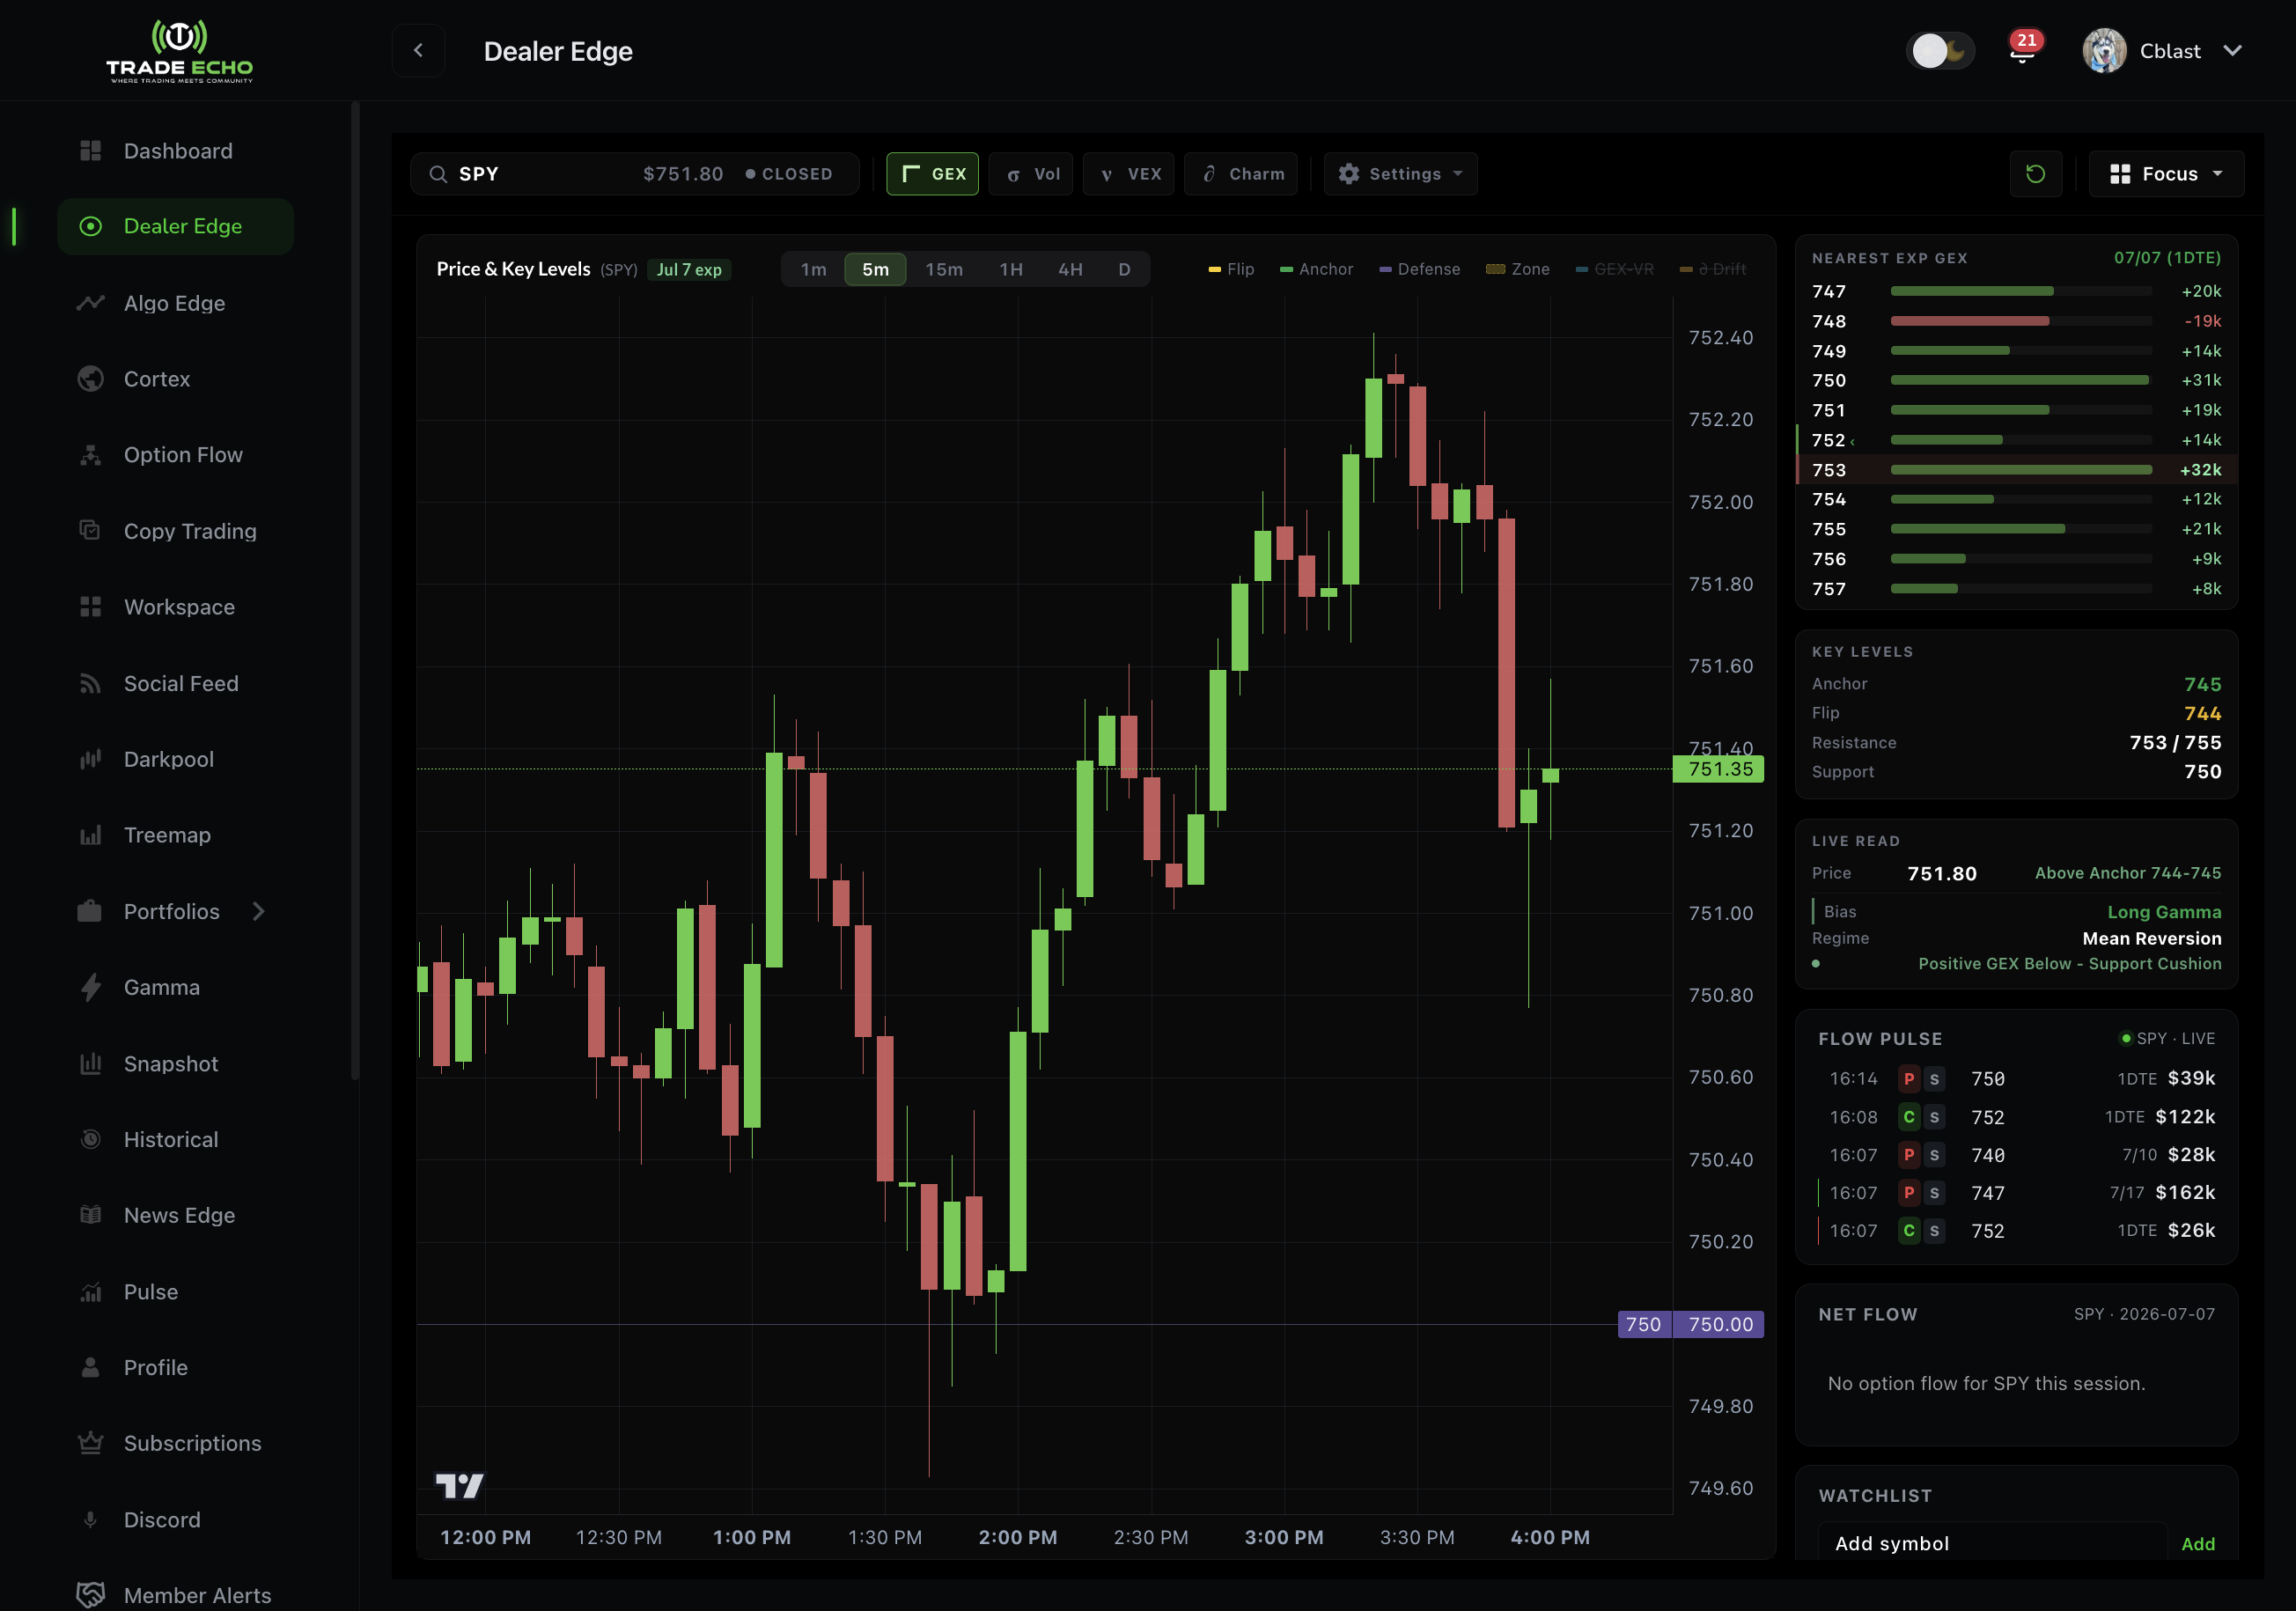
Dealer Edge Net Flow
Net Flow answers the simplest question in options: is more money going into calls or puts on this ticker today? It rolls up the session's option premium and volume into one bias read - a fast sanity check next to the GEX heatmap's structural view.
What it measures
For the current session, per ticker:
| Reading | Meaning |
|---|---|
| Net premium | Call premium minus put premium - green positive, red negative |
| Call/put split bar | Visual share of premium going to calls vs puts |
| Net vol | Call volume minus put volume |
| C/P skew | Call/put ratio (e.g. 2.3x = calls dominating) |
| Calls | Total call premium for the session |
| Bias | The verdict: Bullish, Bearish, or Neutral |
No open interest games, no strike-by-strike detail - just where the session's money leans.
Where to find it
- Dealer Edge Focus panel - Net Flow appears as a card in the per-ticker Focus view
- Workspace tile - add a Net Flow tile to any Workspace layout, one ticker per tile
Both surfaces render the same data, so a reading in your Workspace matches Dealer Edge exactly.
Reading it with GEX
Net Flow and the GEX heatmap answer different questions:
- GEX: where dealers are positioned - walls, flip, pin risk (structure)
- Net Flow: which way today's money is leaning (session direction)
Strong combinations:
| GEX says | Net Flow says | Read |
|---|---|---|
| Positive gamma, price near anchor | Neutral | Pin day - fade edges |
| Negative gamma below flip | Bearish, heavy put premium | Trend risk down - momentum trades |
| Wall overhead | Bullish, calls dominating | Watch for a wall test or break |
If Net Flow flips bias intraday while price presses a GEX level, pay attention - that is often the tell before the level resolves.
Related
- GEX Heatmap Guide - dealer structure by strike
- Charm Lens - time-decay drift near expiry
- Workspace - keep Net Flow tiles for your core tickers