Market Treemap
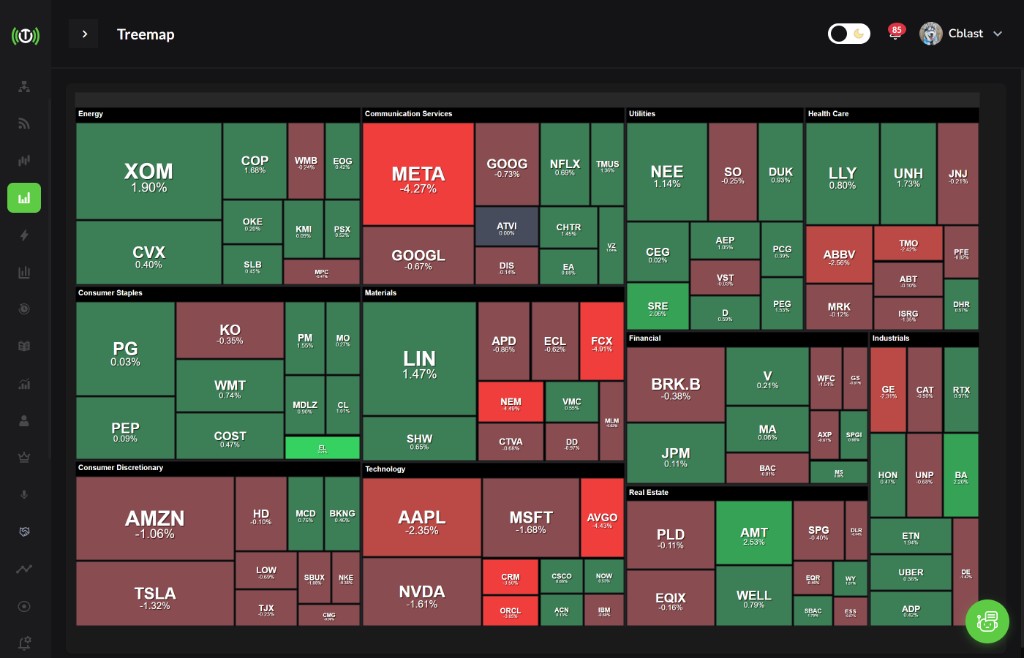
Trade Echo's market treemap is a heatmap of the entire market. Each stock is sized by market cap and colored by performance - green for up, red for down. Use it to quickly spot hot sectors and weak sectors, then drill into opportunities.
What is the Treemap?
Visualization
- Size: Market cap - larger tiles = bigger companies
- Color: Performance - green = up, red = down
- Layout: Sector and industry grouping
What You Get
- Market overview at a glance
- Sector rotation - which sectors are leading or lagging
- Relative strength - green tiles in a red sector = standout names
- Pre-market context - where money is flowing before the open
How to Use the Treemap
Pre-Market Analysis
Before 9:30 AM, scan the treemap for:
- Green clusters: Sectors with broad strength
- Red clusters: Sectors under pressure
- Outliers: Green stocks in red sectors (relative strength) or red stocks in green sectors (relative weakness)
Sector Rotation
- Hot sectors: Large green areas - consider longs in leaders
- Weak sectors: Large red areas - consider shorts or avoid
- Rotation in progress: Mixed colors - sector in transition
Finding Opportunities
- Confirm OptionFlow signals: OptionFlow shows bullish flow on XYZ - check treemap. Is XYZ in a green sector? Higher conviction.
- Validate sector thesis: You're bullish on tech - treemap shows tech green. Thesis supported.
- Spot reversals: Red sector with one green stock - potential bounce candidate or relative strength play.
Using with Other Tools
| Tool | How Treemap Helps |
|---|---|
| OptionFlow | Flow on a stock in a green sector = stronger signal |
| NewsEdge | News on a sector - treemap shows if sector is already moving |
| Snapshot | Sector-level sentiment - treemap shows which sectors have flow |
| DealerEdge | Index-level GEX - treemap shows which names drive the move |
Quick Reference
Daily Workflow
- Pre-market: Open treemap, note green vs red sectors
- 9:30 AM: Compare to OptionFlow - flow in green sectors = priority
- Throughout day: Check for sector rotation or new green/red clusters
- Swing prep: Identify sectors with sustained green for position ideas
Best Practices
- Use treemap for context, not entries alone
- Combine with OptionFlow, Snapshot, NewsEdge for full picture
- Green sector + bullish flow + good chart = high conviction
Next Steps
- OptionFlow Quick Start - Combine treemap with flow
- Snapshot Quick Start - Sector sentiment + treemap