OptionFlow Quick Start
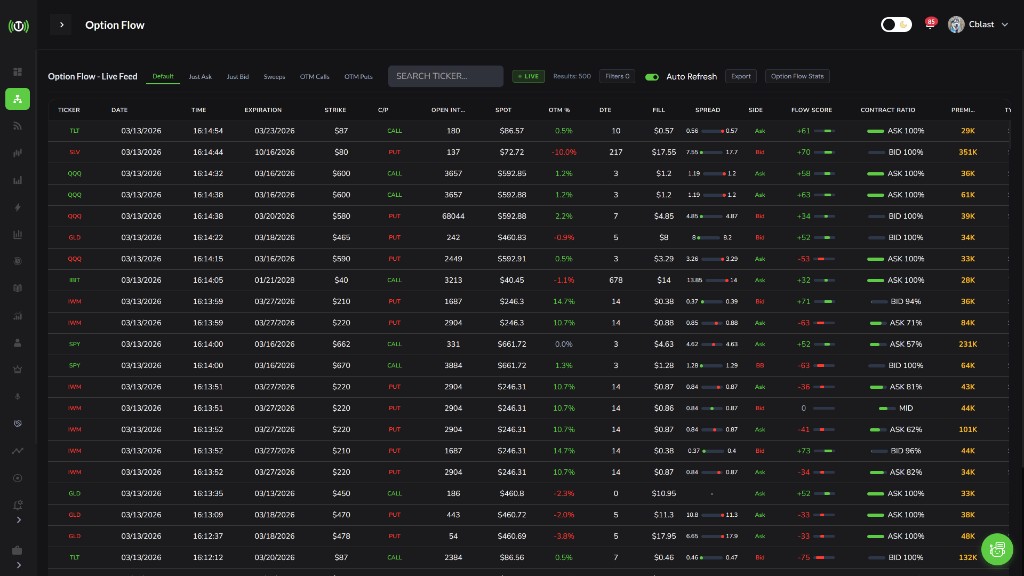
Option Flow tracks real-time options trades, revealing institutional "smart money" moves through detailed metrics like size, value, sentiment, and execution. It acts as your scanner to identify stocks with breakout potential for high-momentum day trading.
What is Option Flow?
What You Get
- Real-time Trade Data: See every options trade as it happens
- Smart Money Tracking: Follow institutional activity
- Advanced Filtering: Target exactly the trades you want
- Momentum Identification: Spot breakouts before they happen
- Premium Tracking: See total capital committed
Why Option Flow Matters
Options are front-running indicators. When institutions buy calls, they expect price to rise. When they buy puts, they expect price to fall. Option Flow shows you where the money is flowing before it becomes obvious on the chart.
Example Alert: "Large trade detected: SPX 3700 Puts 01/16/26 @ 23.90 - Size: 4000x - Value: $9.6 Million."
Someone just bet $9.6M that SPX will drop below $3,700. That is significant.
Target Returns
| Trade Type | Target Returns |
|---|---|
| Short-term options | 50-150% |
| 0DTE trades | 100-300% |
| Momentum plays | 200-500% |
High risk equals high reward. Only risk 1-2% per trade.
Configuring Your Filters
These filters target high-momentum plays that day traders use for 200-500% returns:
| Filter | Setting | Purpose |
|---|---|---|
| Price | Less than $2.00 | Targets low-cost, high-leverage options |
| Size | Greater than 500 | Identifies large trades, institutional interest |
| Sentiment | Bullish | Focuses on trades betting on price increases |
| Execution | At Ask | Selects aggressive buys, showing urgency |
| Expiration | Less than 3 weeks | Prioritizes short-term options; prefer 0DTE for day trading |
Setting Up Your Filters
- Open the Option Flow interface
- Click the Filter button
- Input the settings from the table above
- Enable Auto Refresh for real-time data
- Save your filter preset for quick access
Pro Tips
- Day Trading: Use 0DTE or 1-2DTE only
- Momentum Plays: Copy Algo Edge filters (Size over 3,000, Price under $0.45, Expiration 14 days or less)
- Multiple Presets: Create different filter sets for different strategies
- Update Daily: Market conditions change - adjust filters accordingly
Understanding the Data Format
Trade Display Format
"SPX 2800 Puts @ 11.00 - Size: 6000x - Value: $6.6 Million."
| Part | Meaning |
|---|---|
| SPX | Underlying stock or index |
| 2800 | Strike price |
| Puts | Option type (betting price goes down) |
| @ 11.00 | Premium per contract |
| 6000x | Number of contracts |
| $6.6 Million | Total premium (Price x Size x 100) |
Key Metrics
Size (Contracts): Number of contracts traded. Size indicates institutional interest.
- Under 100 = Retail
- 100-500 = Mixed
- 500-2,000 = Institutional
- Over 2,000 = Whale activity
Value (Premium): Total capital committed.
- Under $10K = Small bet
- $10K-$100K = Medium interest
- $100K-$1M = Big interest
- Over $1M = Huge commitment
Sentiment: Directional bias. Bullish = calls (price up). Bearish = puts (price down). Neutral = hedging.
Execution: How the trade was executed. At Ask = aggressive buyer. At Bid = willing seller. Between = negotiated.
Finding Momentum Setups
Trade Clusters
Multiple bullish trades on the same stock indicates strong buying pressure. This is one of the strongest signals.
Example: Four alerts on XYZ, all bullish, all at ask, all 0DTE. Total 2,800 contracts, $525K premium. This is a momentum play.
Other Signals
- High Premium Trades: Premiums over $100K show significant capital commitment
- Volume Over Open Interest: Suggests new positions being opened
- Strike Clustering: Multiple trades on same strike = key level importance
Sorting Options
- Sort by Premium: Find the biggest commitments first
- Sort by Volume: Find the most active trades
- Sort by Size: Find the largest contract sizes
Confirming with Price Action
Option Flow identifies candidates; price action validates entries. Never trade from alerts alone - always check the chart first.
What to Look For
- Breakouts: Price breaking above resistance with high volume + heavy call buying in Option Flow
- Support Bounces: Price rebounding from support + shift from puts to calls in Option Flow
- Bullish Patterns: Hammers, bullish engulfing, morning stars + bullish sentiment in Option Flow
Chart Indicators
- RSI: Oversold (30) before buying calls
- Moving Averages: Price above 20MA = bullish trend
- Volume: Higher than average confirms move
- VWAP: Price above VWAP = bullish intraday
Executing Your Trades
Entry Strategy
- Option Flow alert received - trade meets your filters
- Check price action - validate on chart
- Select strike - same strike as alert or slightly OTM
- Check liquidity - tight bid-ask spread, high volume
- Enter quickly - prices move fast on momentum
Liquidity Check
Good Liquidity: Bid-ask spread under $0.05, volume over 100, open interest over 500
Poor Liquidity: Bid-ask spread over $0.10, volume under 50, open interest under 100 - avoid
Target and Stop Table
| Trade Type | Target | Stop Loss | Exit Time |
|---|---|---|---|
| 0DTE | 50-100% gain | 20% below entry | 1-2 hours before close |
| 1-3 DTE | 75-150% gain | 25% below entry | Same day if up big |
| 1-2 weeks | 100-200% gain | 30% below entry | Watch support |
Risk Management
Golden Rules
- Position Sizing: Only risk 1-2% of capital per trade
- Stop-Losses: Always set 20-30% below entry
- Time Exits: Exit 0DTE trades 1-2 hours before expiration
- Liquidity: Only trade options with tight spreads
- Track Performance: Review what works, stop what does not
Position Sizing Calculator
- Account: $10,000
- Max Risk: 2% = $200
- Option Premium: $2.00
- Stop Loss: $1.60 (20% below)
- Max Loss Per Contract: $0.40
- Contracts: $200 divided by 0.40 = 5 contracts max
Common Mistakes
- Over-sizing: Risk 2% max, not 50%
- No stop loss: Always set stop before entering
- Holding into close: Exit 0DTE by 2 PM
- Poor liquidity: Only trade tight spreads (under $0.05)
PDT Rule
If you have less than $25K: limited to 3 day trades per 5 trading days. 0DTE = day trade. Choose your 3 best setups per week only.
Quick Reference
Daily Workflow
- 9:30 AM: Open Option Flow, enable Auto Refresh
- 9:31 AM: Apply filters (Size over 500, Price under $2, under 3 weeks)
- 9:35 AM: Watch for first high-value alert
- 9:36 AM: Check price action on chart
- 9:40 AM: If confirmed = Enter trade with stops
- Throughout day: Monitor for additional clusters
- 2:00 PM: Exit all 0DTE positions
- End of day: Review performance
Decision Tree
START → Option Flow Alert
Size >500 contracts?
├─ NO → Ignore (not big enough)
└─ YES → Value >$100K?
    ├─ NO → Ignore (low commitment)
    └─ YES → Single direction (bullish OR bearish)?
        ├─ NO → Ignore (hedge)
        └─ YES → Check price action:
            ├─ Supports direction? → YES = ENTER TRADE
            └─ Multiple alerts on same stock? → YES = STRONG SIGNAL
Top 5 Rules
- Filter everything - only look at trades that meet your criteria
- Verify always - check price action before every trade
- Size smart - risk 1-2% max per trade
- Set stops - always know your exit point
- Exit early - close 0DTE by 2 PM