Platform Overview
Trade Echo is your complete trading ecosystem, combining portfolio management, real-time market intelligence, AI-powered insights, and a vibrant trading community in one place. This guide covers the web dashboard, the mobile app's five main sections, and how to get started.
Pricing
Trade Echo offers a single all-in-one plan at $199/month, giving you access to every feature without tiered limitations.
The Web Dashboard
The web dashboard is the full terminal. Everything lives in the left sidebar:
| Area | Pages |
|---|---|
| Journal & performance | Trade Journal (Dashboard) with calendar, trade log, stats, and Discipline Score; Upload Trades; Broker Sync |
| Your terminal | Workspace - compose your own multi-tile screen from 18 tile types |
| Futures | Futures / Echo Map - live futures session command center; included in all memberships (one-time in-app CME attestation required) |
| Options flow | Option Flow + Option Flow Stats |
| Dealer positioning | Dealer Edge (GEX / Vol / VEX / Charm heatmap, Net Flow), Gamma |
| Market scanning | Algo Edge (9 channels), Darkpool, Snapshot, Treemap, Historical, Pulse chart, Watchlist |
| Rotation | Rotation Lab - relative rotation of sectors and tickers; see Reading the Rotation Map for the playbook |
| News | NewsEdge live headlines and catalysts |
| AI | Cortex chat, Agent Builder, and Marketplace |
| Community | Social Feed, Member Alerts with Top Traders leaderboard |
| Copying & portfolios | Copy Trading, Portfolios and Mirrors (My Portfolios, Community Portfolios, My Mirrors Beta) |
| Extras | Courses, Member Gear |
If you only remember one thing: the sidebar is organized so research (flow, dealer positioning, dark pool, news) sits next to action (journal, copy trading, portfolios). Start your day at the top, end it in the journal.
The Five Main Sections (Mobile App)
You will find five core tabs at the bottom of the mobile app:
| Section | Description |
|---|---|
| Dashboard | Trading journal, analytics hub, and performance tracker |
| Social | Trading community feed - learn from real traders |
| Markets | Market intelligence tools (OptionFlow, AlgoEdge, DealerEdge, etc.) |
| Leaderboard | Rankings by trades, win rate, and profit % |
| Profile | Account settings, subscription, themes, notifications |
Section 1: Dashboard
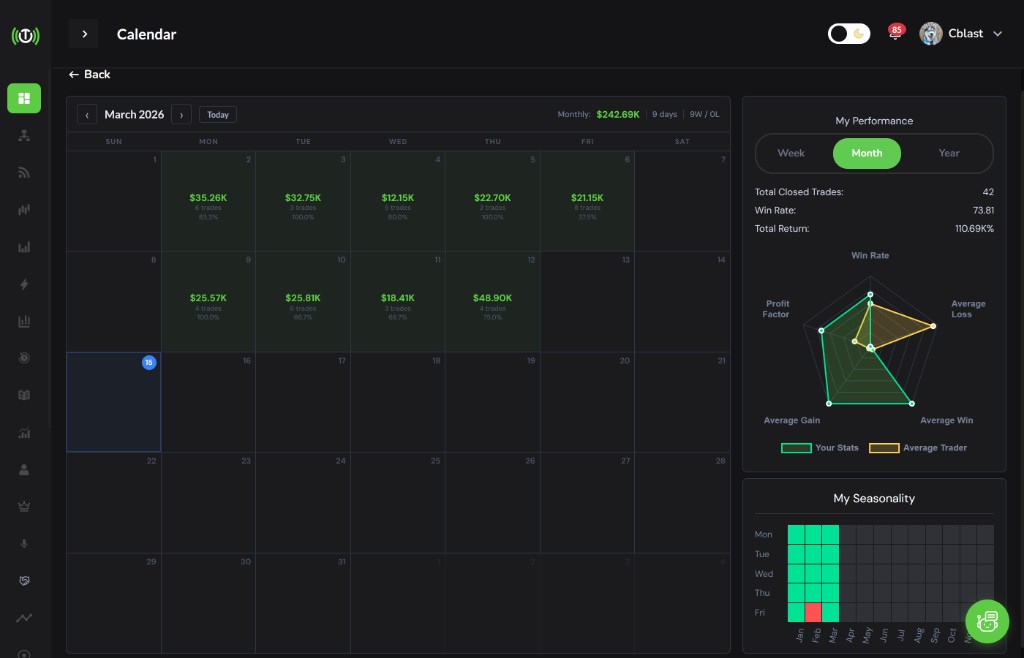
Your Dashboard is your trading command center.
Adding Trades
- Manual Entry: Tap Add Trade, enter ticker, prices, dates, quantity, trade type, add optional notes, save.
- Bulk Upload: Tap Upload Trades File, upload .xlsx, .xls, or .csv - all trades import automatically.
Managing Trades
- Search by ticker
- Filter by date range, P/L, or trade type
- Edit or delete trades
- Batch-select multiple trades
- Tap into any trade for full details
Calendar View
- See your highest-activity days
- Identify best and worst days
- Spot weekly and monthly performance cycles
Statistics Dashboard
- Win rate, total P/L, average win, average loss, profit factor
- Top trades and worst losses
- Time-based analysis (daily, weekly, monthly, yearly)
AI Portfolio Assistant
Tap the AI icon to ask personalized questions such as:
- "What was my best trade this month?"
- "Which tickers am I most profitable with?"
- "What is my win rate on tech stocks?"
- "Show me my worst trade this quarter."
Section 2: Social Feed
The Social Feed is focused on actionable trading insights.
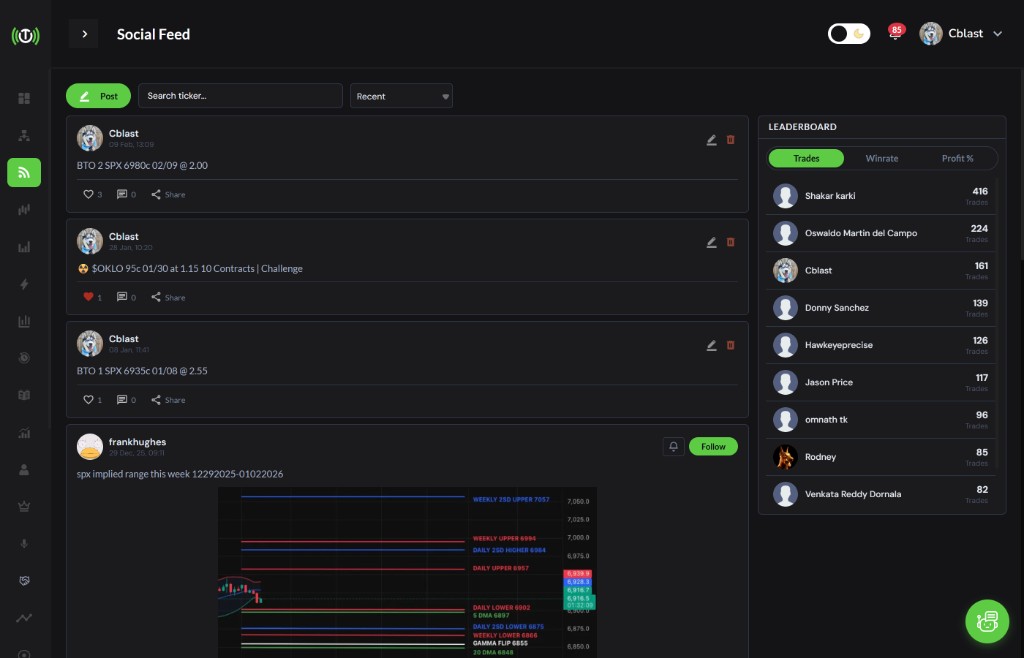
- Filter by Recent, Followers, Following, or Notified Posts
- Search by ticker (e.g. AAPL or TSLA)
- Create posts with your thesis, charts, and questions
- Engage with likes, comments, follows, and shares
- View user profiles, their posts, statistics, and followers
Section 3: Markets
The Markets section houses the market intelligence tools for real-time trading decisions.
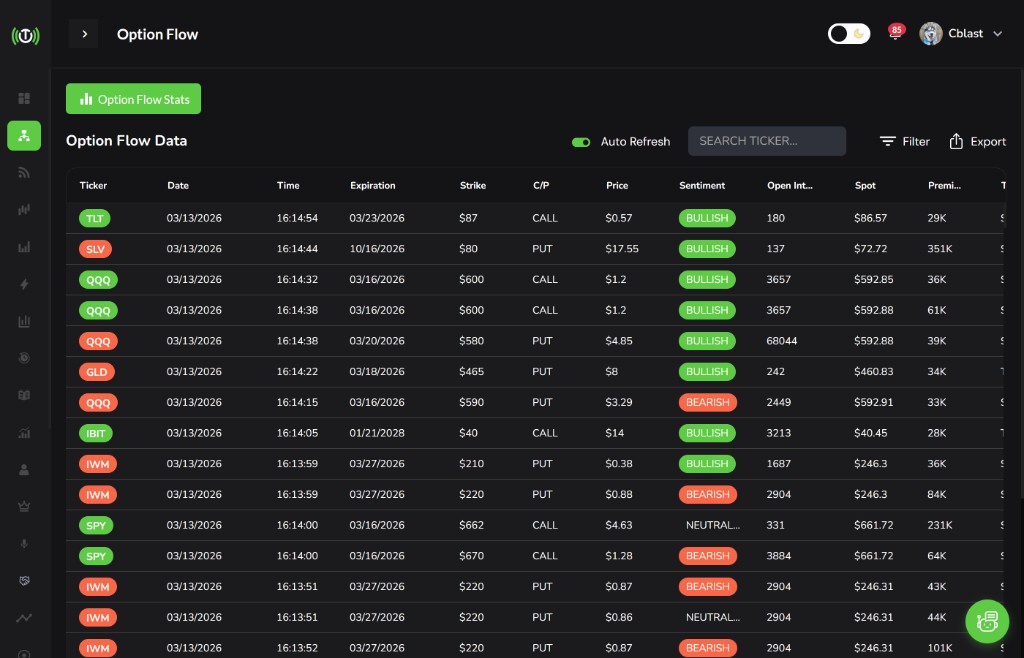
OptionFlow
Track smart money with large options trades, call/put ratios, volume spikes, trade premiums, and bid/ask behavior. Includes an AI Flow Assistant for queries like "Show me today's 1M+ options flow" or "Top unusual options activity right now."
AlgoEdge
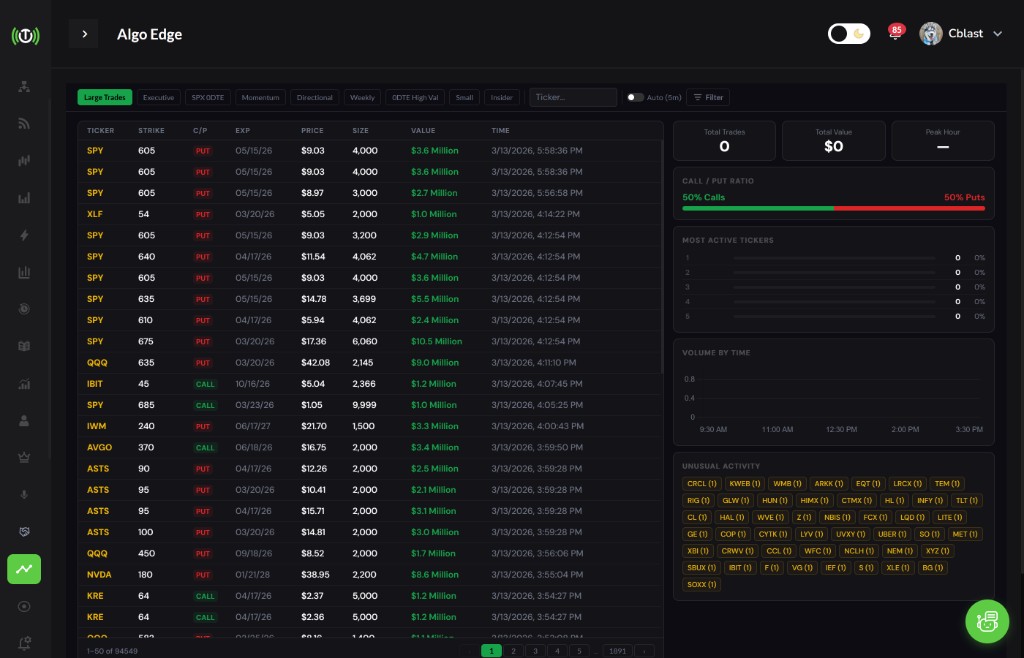
Algorithmic trading signals with automated alerts, market pattern detection, and auto-refresh. Use as a confirmation tool - never blindly follow signals.
DealerEdge (Gamma)
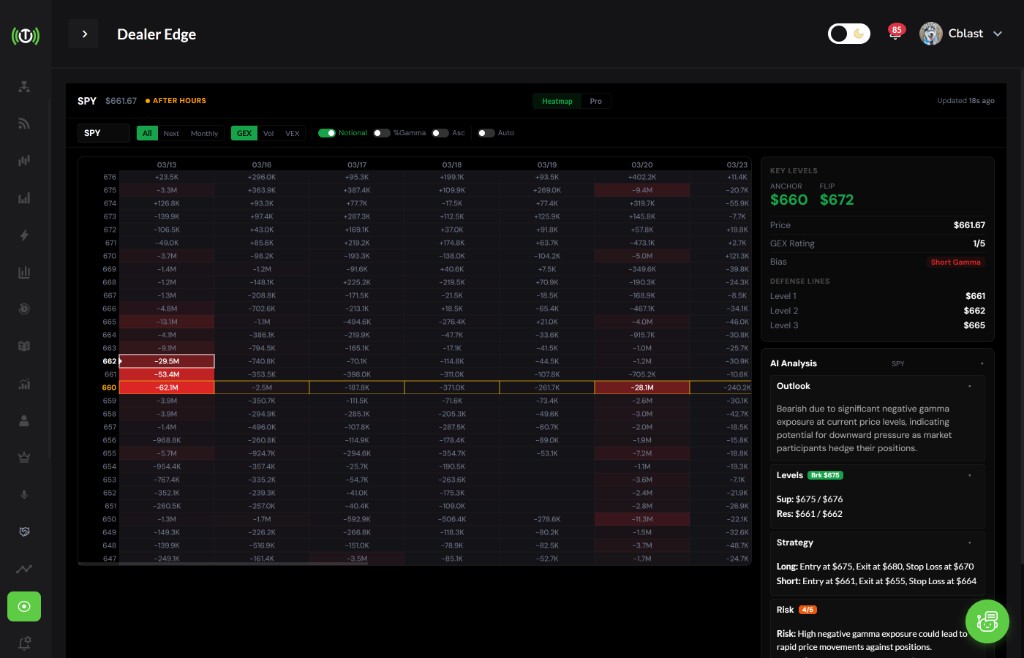
Understand dealer positioning with gamma exposure for SPX, NDX, SPY, and QQQ. See support/resistance from gamma, expiry effects, and dealer hedging behavior.
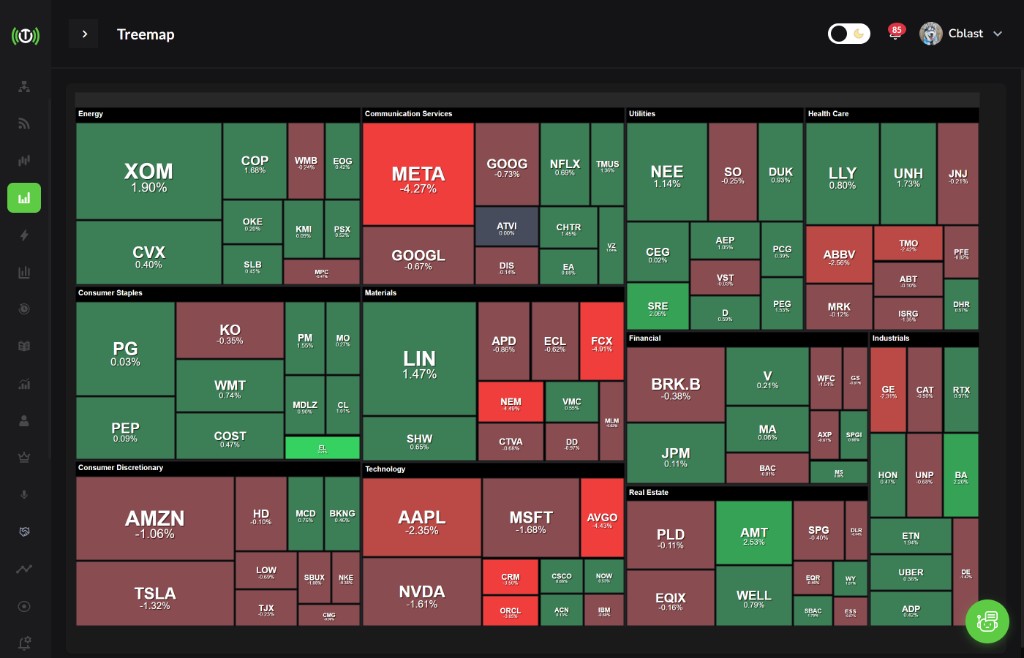
Treemap
A heatmap of the entire market sized by market cap and colored by performance. Quickly identify which sectors are hot and which are weak.
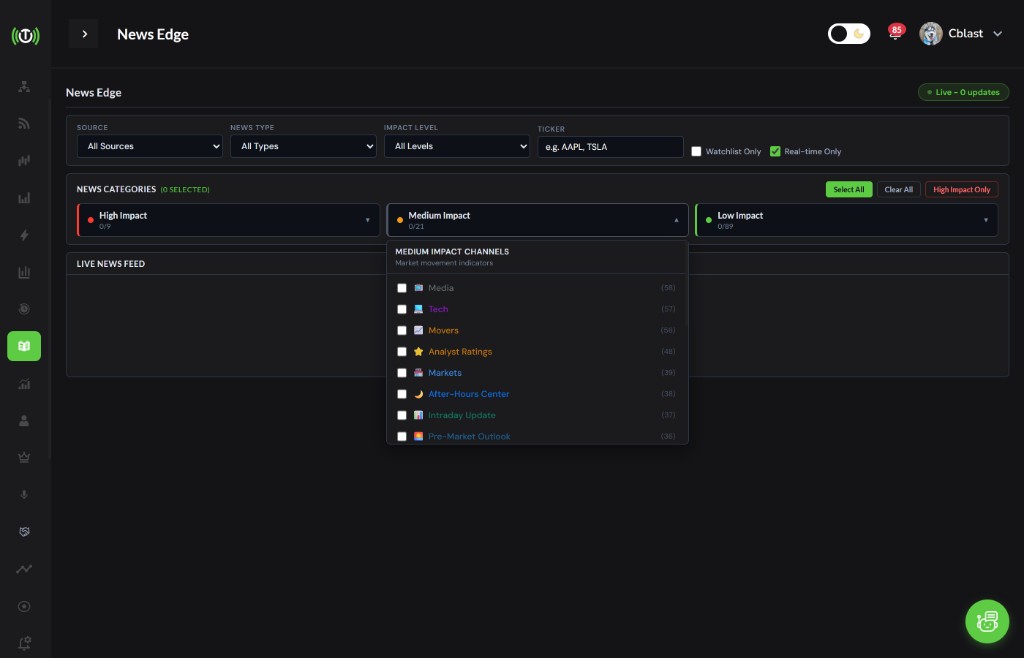
NewsEdge
Real-time market headlines and ticker-specific news. Filterable and searchable. Use it daily.
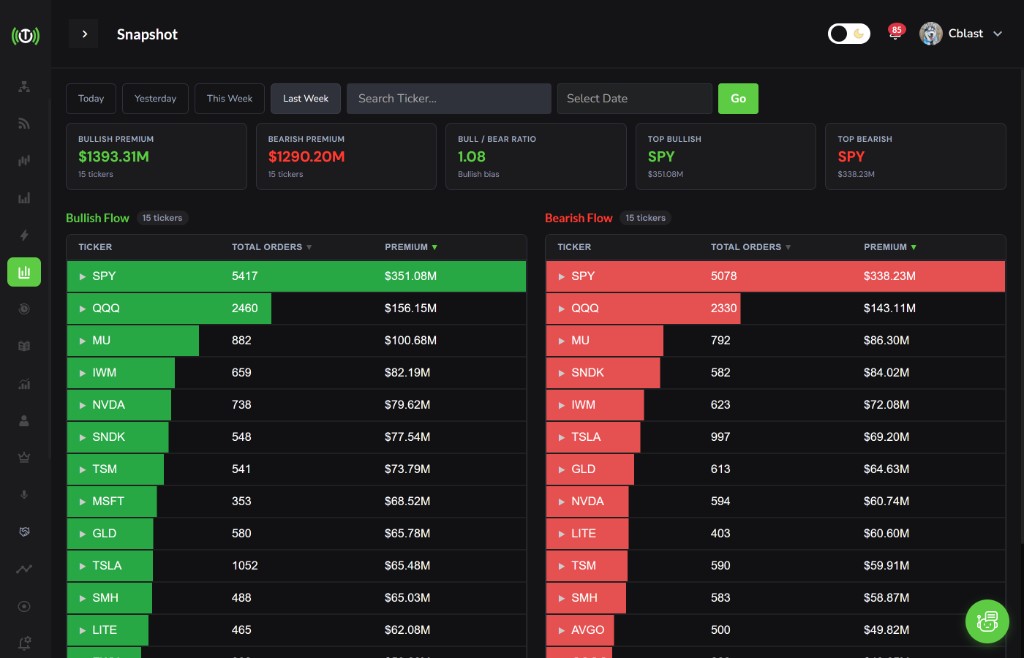
Snapshot
Market overview with bullish vs. bearish sentiment, premium trends, and ticker-level breakdowns. Filters for Today, Yesterday, This Week, etc. Perfect for pre-market prep.
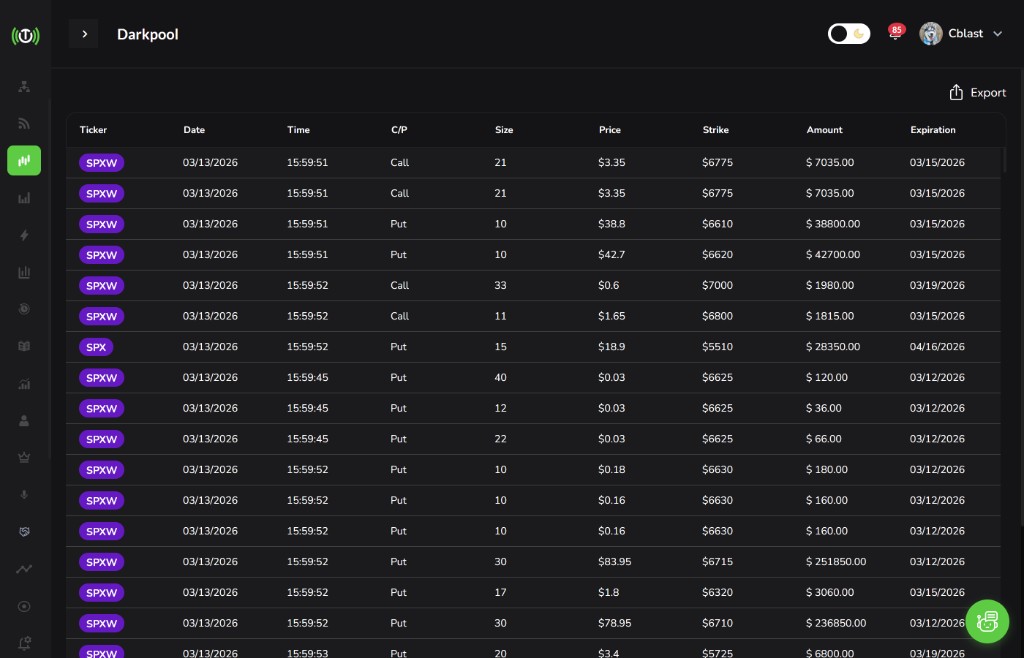
Dark Pool
Real-time dark pool trades with size, price, strike, and amount data. On web, prints are scored with EchoScore and badges.
More Tools
- Watchlist and Watchlist Radar
- Ticker Statistics and Historical Data
- Notification preferences for GEX levels, flow tiers, Algo Edge channels, and followed traders
Section 4: Leaderboard
Rankings by trades, win rate, and profit %. Learn from top traders and track your own performance.
Section 5: Profile
Manage profile settings, themes (Dark/Light/System), subscription, payment methods, coupon codes, notification settings, blocked users, and help articles.
Getting Started Checklist
- Create your account
- Add or upload trades
- Explore the Stats dashboard
- Set up your watchlist
- Ask the AI assistant a question
- Follow 3-5 traders
- Make your first post
- Set notification preferences
- Explore Option Flow
- Customize your theme
4-Week Plan
| Week | Focus |
|---|---|
| Week 1 | Track every trade |
| Week 2 | Use Market tools for research |
| Week 3 | Engage in the Social Feed |
| Week 4 | Review stats and optimize |
Success comes from consistency, data review, community learning, and using all tools together.