Rotation Lab
Money does not leave the market - it rotates. Rotation Lab plots every symbol in a universe on one four-quadrant view: relative strength versus a benchmark on the horizontal axis, relative momentum on the vertical. One glance answers "who is leading, who is fading, and who is next" - the question a wall of individual charts hides.
Open it from the sidebar at app.tradeecho.com/rotation-lab, or add it as a tile from Workspace → + Add tile → Rotation Lab.
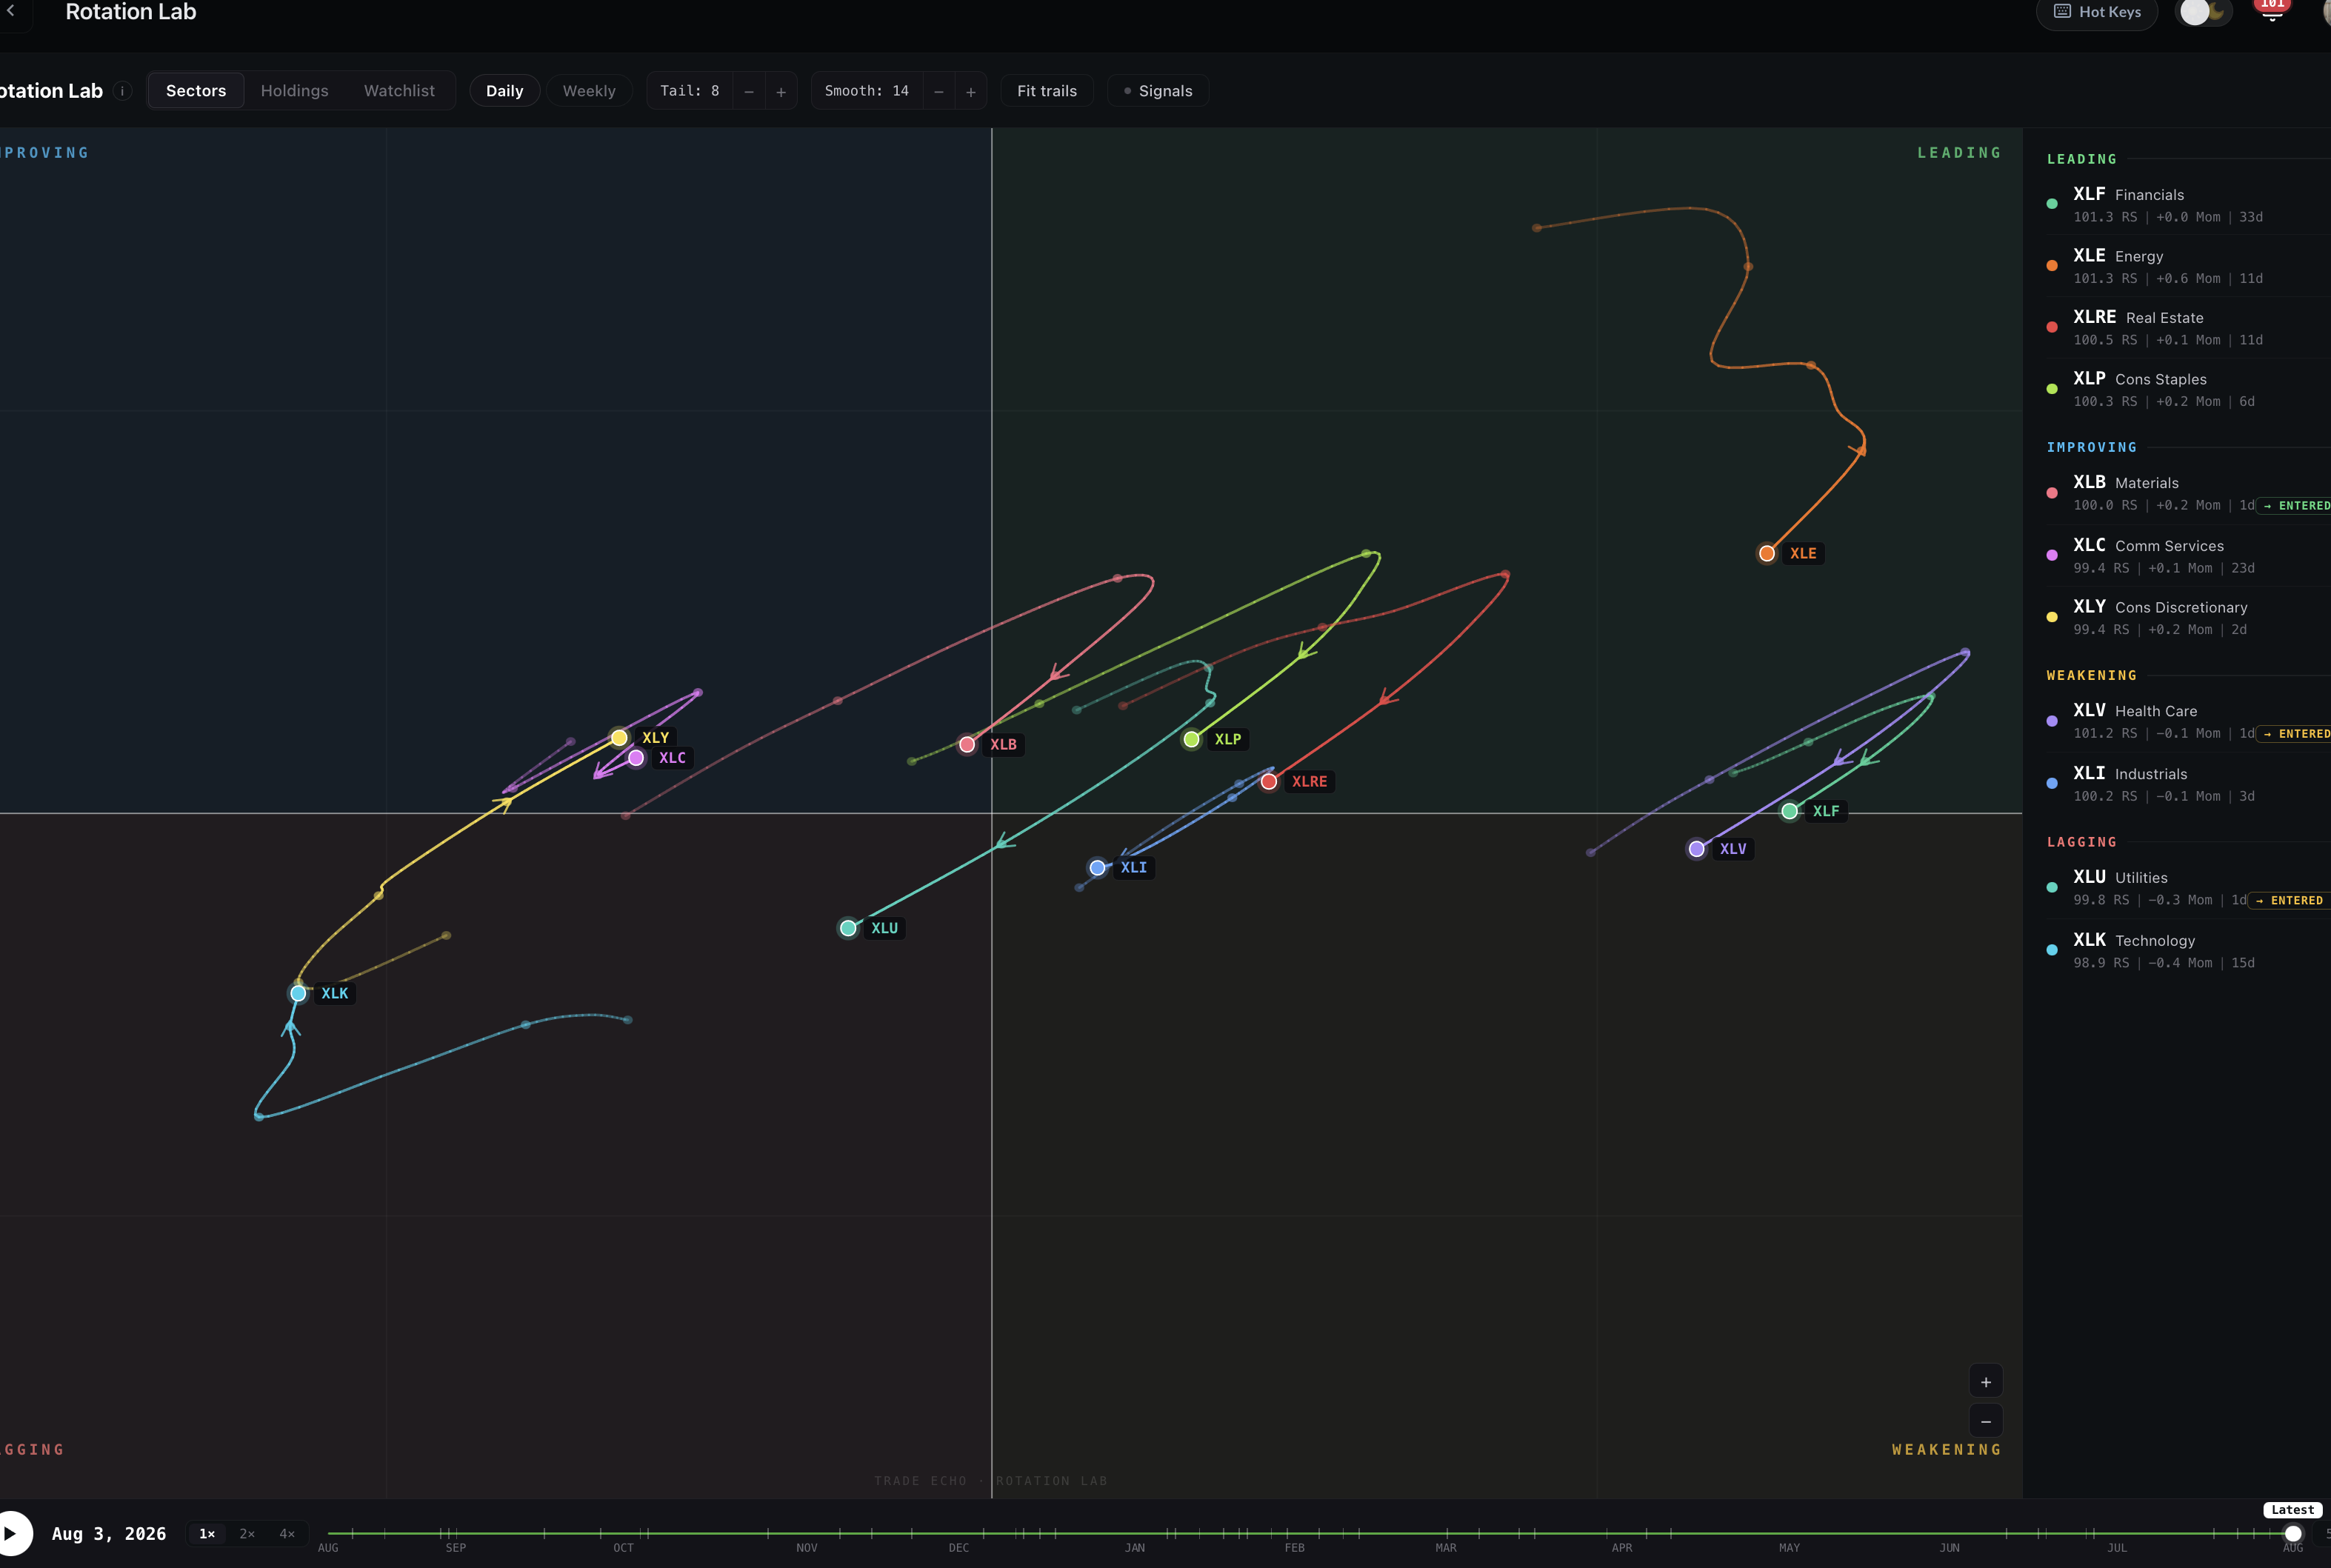
The four quadrants
| Quadrant | Where | What it means |
|---|---|---|
| Leading | Top right | Outperforming the benchmark and still gaining momentum - the current winners |
| Weakening | Bottom right | Still outperforming, but momentum is rolling over - winners losing steam |
| Lagging | Bottom left | Underperforming with falling momentum - the current losers |
| Improving | Top left | Still underperforming, but momentum has turned up - candidates for the next leg |
Names typically rotate clockwise: Improving → Leading → Weakening → Lagging → back to Improving. The center of the plot is the benchmark itself - relative strength reads 100 and relative momentum reads 0 there.
Universes and benchmarks
Three modes on the toolbar:
- Sectors - the 11 SPDR sector ETFs (XLK, XLF, XLV, XLY, XLP, XLE, XLI, XLU, XLB, XLRE, XLC) plotted against SPY. The macro rotation picture.
- Holdings - click into any sector to drill down: its top 10 holdings plotted against the sector ETF itself. See which stocks are driving the sector's move - and which are just along for the ride. A breadcrumb menu switches sectors without leaving the view.
- Watchlist - your own watchlist tickers plotted against SPY. Symbols need roughly 3 months of trading history to chart.
The benchmark follows the mode (the toolbar shows VS SPY, or VS the sector ETF in Holdings) - drilling into Holdings is how you change the comparison, not a separate picker.
Tails - rotation over time
Each symbol is a dot (now) with a tail (the recent path). The tail's shape is the story:
- A tail curling clockwise through Improving toward Leading is rotation happening in real time.
- A long, accelerating tail means the move is picking up speed; a short, stalling tail means it is losing conviction.
- The Tail stepper sets how many periods of history each tail shows; Smooth adjusts how reactive the underlying model is.
- 1H / 4H / Daily / Weekly toggles the timeframe - 1H and 4H for intraday rotation, Daily for tactical swings, Weekly for the bigger regime (Weekly resamples daily bars).
- Fit trails zooms out to include every tail point; the zoom controls let you push in on the cluster around the center.
Click any symbol (on the plot or in the quadrant rail) to focus it and dim the rest. The rail groups every name by quadrant with its relative strength, momentum, time-in-quadrant, and heading arrow.
Live drift and playback
- Live - during market hours the newest point drifts intraday: live quotes (refreshed about every 5 seconds) update today's position, so you can watch a name press toward a quadrant boundary in real time. A LIVE badge shows when the feed is active.
- Playback - the scrub bar at the bottom replays about six months of rotation history. Hit play (1x / 2x / 4x), or drag the knob; range pills (5D / 1M / 3M / 6M) size the window, and tick marks flag the days a name entered Leading.
- Signals - toggles a highlight mode that flags actionable transitions: quadrant entries, symbols crossing the 100 centerline of relative strength, and momentum reversals.
Reading tips
- Shop in Improving, not Leading. By the time a sector is deep in Leading, much of the move has happened. The highest-value names are in Improving with tails accelerating toward Leading - confirm with Dealer Edge or OptionFlow before acting.
- Weakening is a warning, not a sell signal. Strong names routinely dip into Weakening and hook back into Leading. A tail that keeps pushing deeper toward Lagging is the real rotation-out; a shallow curl back up is a pause.
- Drill before you buy the sector. A sector can sit in Leading on the strength of two mega-caps. Open Holdings and check breadth - broad participation in Leading and Improving is a healthier rotation than one crowded winner.
For the full seasons metaphor, golden-hook setups, and the sector → holdings → OptionFlow → chart playbook, see Reading the Rotation Map.
Next Steps
- Reading the Rotation Map - axes, quadrants, tails, and member-style playbook
- Snapshot - market-wide sentiment to pair with the rotation picture
- Darkpool - are institutions transacting in the names rotating in?
- Workspace - keep Rotation Lab next to your chart